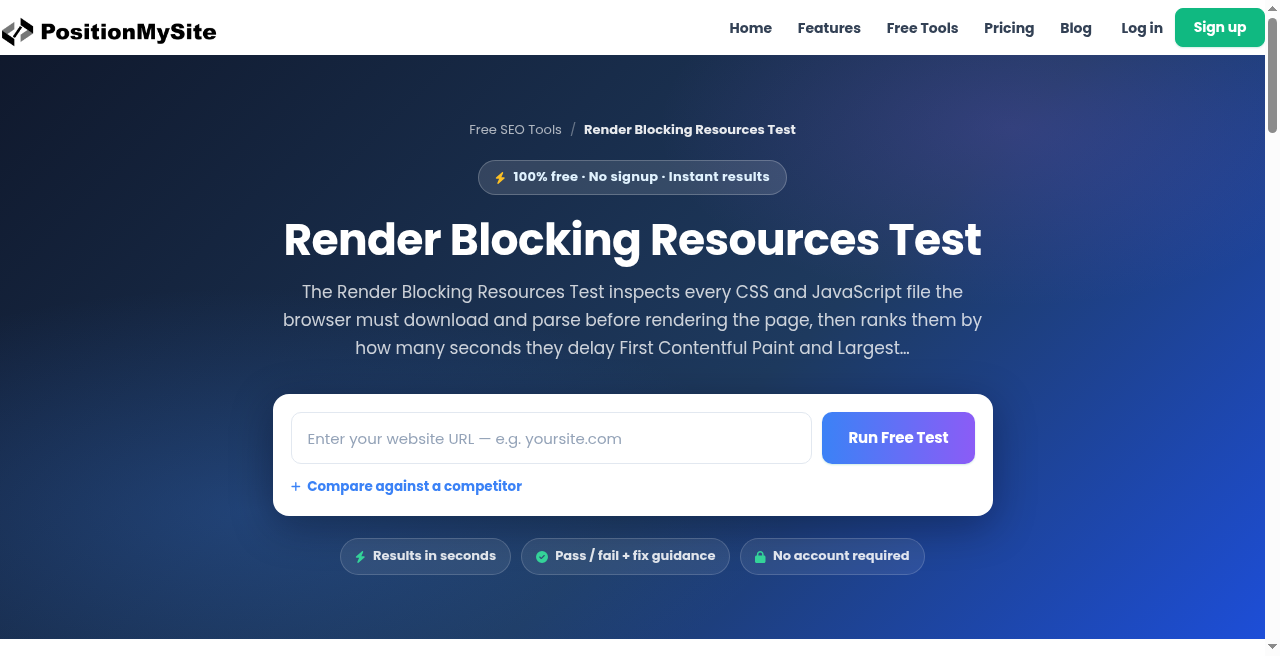
If you searched for a render blocking resources test, you want a concrete list of CSS and JavaScript files that sit on the critical path of one live URL. Site Signals has that check. Run it before you rename the ticket “fix Core Web Vitals” and hope Lighthouse vibes turn into ranking recovery.
Render-blocking resources are stylesheets and scripts the browser must download and process before it can paint meaningful content. A late first paint almost always has a blocking file in the story. Google’s ranking set still centers on LCP, INP, and CLS, but those field metrics do not tell you which asset delayed the paint. That is what this free test is for.
What “render-blocking” actually means
In Chromium’s loading model, a classic <link rel="stylesheet"> in the document head and a classic synchronous <script> without async or defer both stall first paint until they finish. The browser needs the CSSOM to know how to style the page. It pauses HTML parsing for blocking scripts so they can mutate the DOM. That is correct default behavior. It is also how a marketing tag or a 400 KB theme CSS file can push first paint past 1.8 seconds on mobile.
Not every CSS or JS file is equally guilty. Fonts, images, and third-party iframes can hurt LCP without showing up as classic render-blockers. That is why you should not merge this audit with a generic page-speed score. Isolate the blocking list first, then decide whether the remaining pain is fonts, hero weight, or server TTFB.
Run the free Render Blocking Resources Test
Open the Render Blocking Resources Test, paste a production URL, and run it. You want the filenames and sizes that Chromium treats as blocking on that URL, not a blog post that says “minify everything.”
Read the results in order:
- Stylesheets in the head that are required for above-the-fold layout
- Scripts without
async/deferthat run before first paint - Third-party bundles that loaded early because someone put them in the head “just in case”
If the same theme CSS appears on every template, fix the template once. If only the checkout page loads an extra analytics bundle in the head, fix that template and leave the blog alone. Site Signals also has sibling checks for First Contentful Paint and Largest Contentful Paint when you need to separate first paint from largest paint. Keep those tickets separate.
Fixes that usually move the number
Start with the smallest change that removes a real blocker:
- Defer non-critical JS. Anything that is not needed to paint the first screen should use
defer(orasyncfor independent tags). Product analytics, chat widgets, and A/B libraries rarely belong in a blocking head script. - Split critical CSS. Inline a tiny critical set for the hero and nav, then load the rest asynchronously or later in the body. Do not inline your entire design system.
- Move third parties down. If a tag manager injects blocking CSS or JS early, load it after first paint or behind a consent gate that does not stall the parser.
- Stop shipping unused CSS. Framework and page-builder CSS often ships megabytes of selectors the page never uses. Purge or scope before you buy a faster CDN plan.
- Confirm in the field. After the deploy, re-run the free test on the same URL, then check Search Console’s Core Web Vitals / CrUX view for that template. Lab green is not field green.
How this differs from a generic “slow site” post
A render-blocking audit answers one question: which CSS and JS files delayed first paint on this URL. It does not replace image compression, CDN setup, or a full LCP investigation. If FCP is already healthy and LCP is not, chase the largest element, not the stylesheet list. If FCP is late and the blocking list is long, fix the list first. Mixing those into one vague speed ticket is how teams ship three months of “optimization” with no ranking change.
web.dev and Chrome docs still treat render-blocking CSS/JS as a first-paint lever. Use that framing in the ticket: name the file, name the template, name the owner. Then re-test.
A practical triage order
When the test returns a long list, do not rewrite the whole stack in one afternoon. Triage like this:
- First-party theme CSS that every page loads → critical-path work for the design system owner
- First-party app JS required for the first interaction → keep it, but measure whether it must block parse
- Marketing and support tags → defer or consent-gate unless legal requires an early load
- A/B and personalization scripts → load after first paint unless the experiment literally changes the first screen
Write the ticket with the URL you tested, the top three blocking URLs, and the owner for each. That is enough for an engineer to ship a fix without reading another essay about “performance culture.”
When to run it again
Re-run the render blocking resources test after theme updates, tag-manager changes, and any “we added one small script” release. Blocking files creep back in through plugins and experiments. A five-minute paste into Site Signals is cheaper than discovering the regression in a quarterly CrUX review.
If you want the broader 80-signal pass after you clear the blockers, start from the free audit hub on tools.positionmysite.com/tools. For the specific CSS/JS delay problem, stay on the render-blocking tool until the critical path is clean.